Method
How the modelling works
One variable is changed at a time. The plant, the weather and the operating limits are held constant, so the difference in the bill comes from the tariff or the asset and not from the comparison itself.
1. Your plant
Built from inflow and load profiles, pump curves, blower and aeration limits, tank and reservoir volumes, sludge handling and installed equipment, at five minute resolution. It operates within your limits and does not assume capability the plant does not have.
2. Both tariffs
The same plant and the same year are run under each tariff. Energy, demand and fixed charges are reported separately, so the result shows which line moved and by how much.
3. Each asset
Solar, a battery, both, or a process change is added and run under each tariff, so the asset is valued against the tariff it will actually operate under.
What the report contains
By tariff
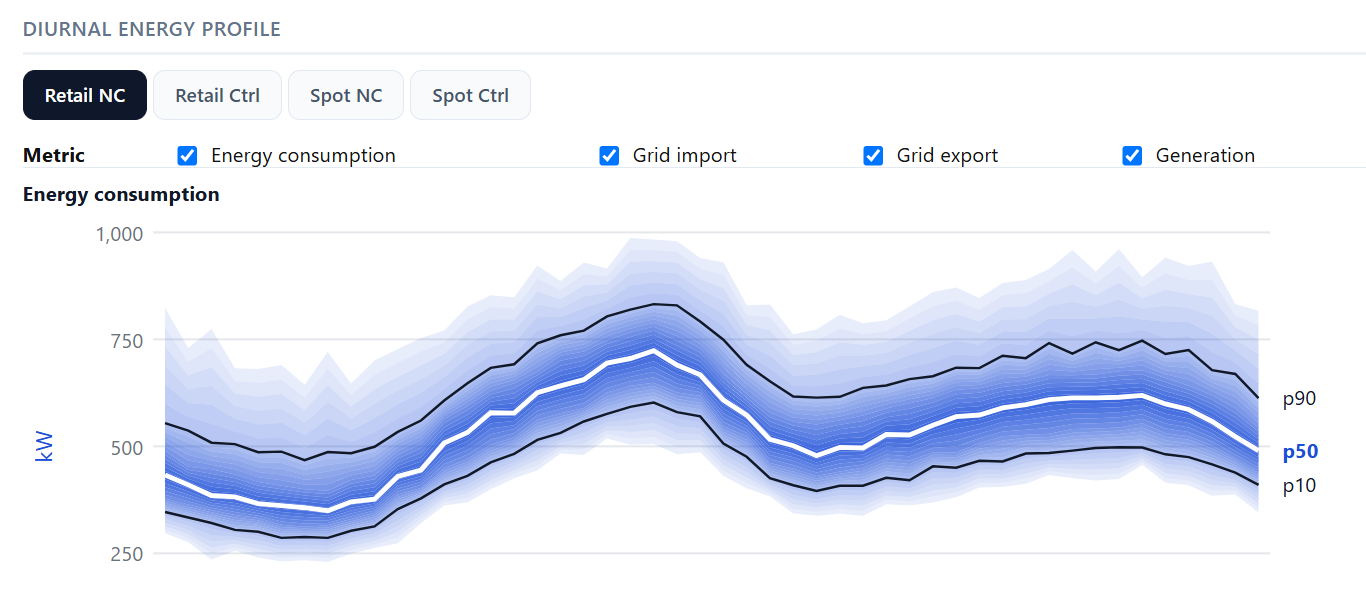
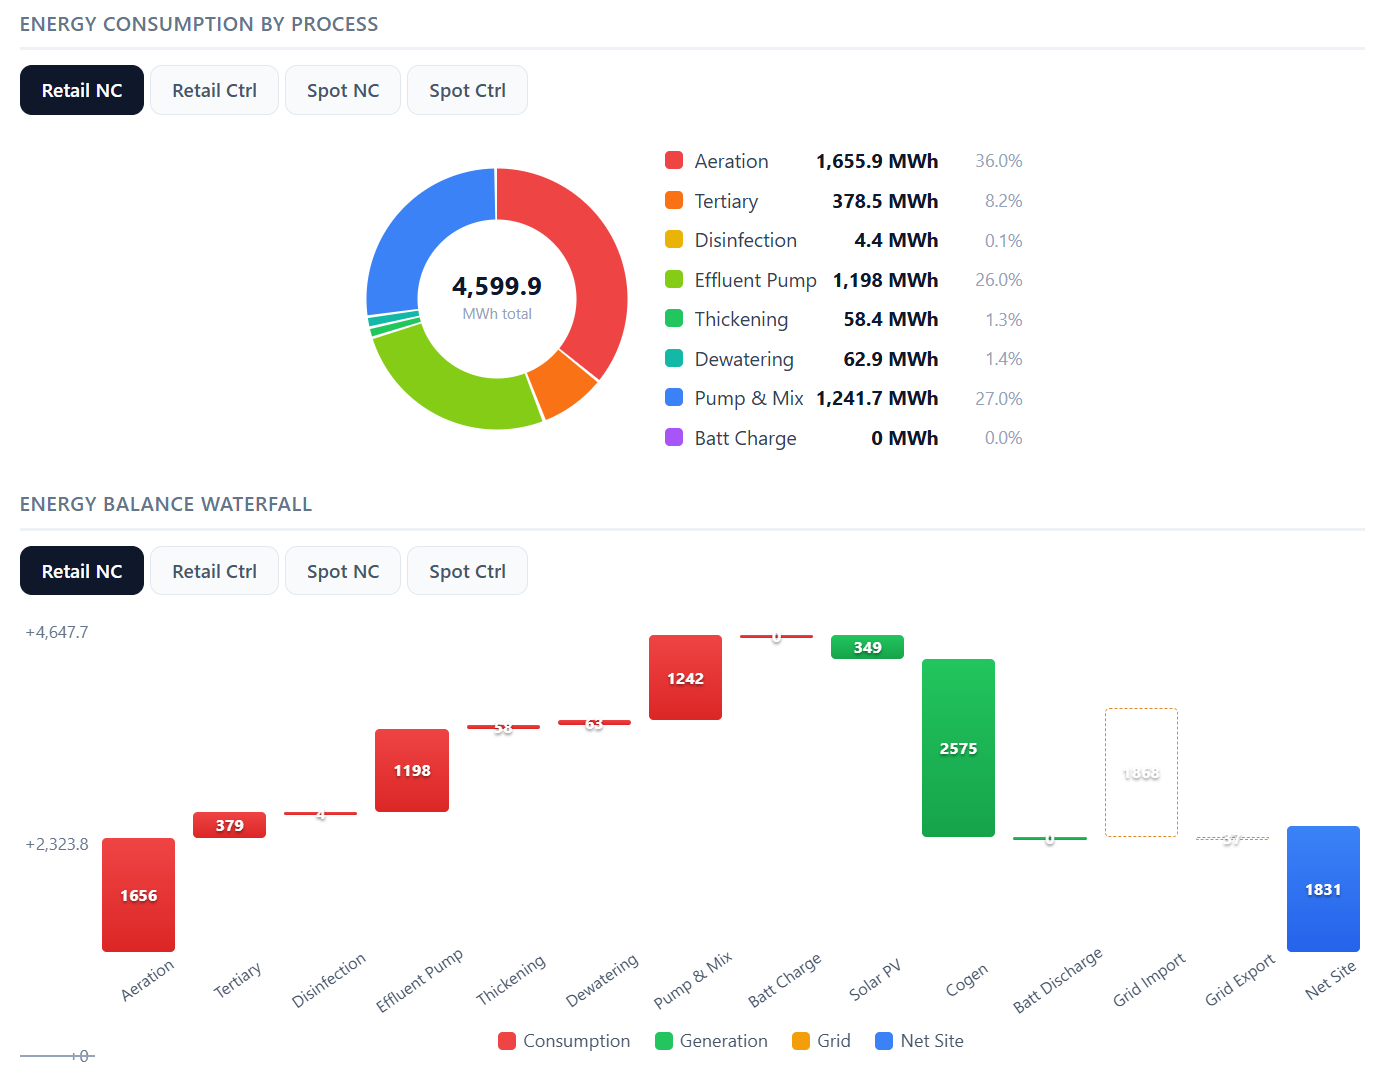
Energy, demand and fixed charges, reported separately. Effluent quality against your limits. Energy by process area.
By asset
Capital cost, annual saving, payback, net present value at the required return, and the return achieved, measured against the base case.