
Plant setup
What an asset is worth depends on the tariff it operates under, so each one is run under each tariff rather than valued on its own. The result is a capital cost, an annual saving and a payback for your plant.
Solar
Cuts daytime import while it is generating, which lowers the energy charge and the demand charge in those hours. It is modelled hour by hour against your load, cloud cover and the tariff windows, so the saving follows your own load shape rather than an average.
Batteries
Earns by moving energy from a low-price period to a high-price period, and by holding import below the demand target. Both draw on the same stored energy, so on some tariffs they compete and the second saving is smaller than it looks on its own.
Process change
Aeration, pumping and sludge handling cost little to trial, so they are reported as an annual saving. Where an implementation cost is entered, a payback is reported as well.
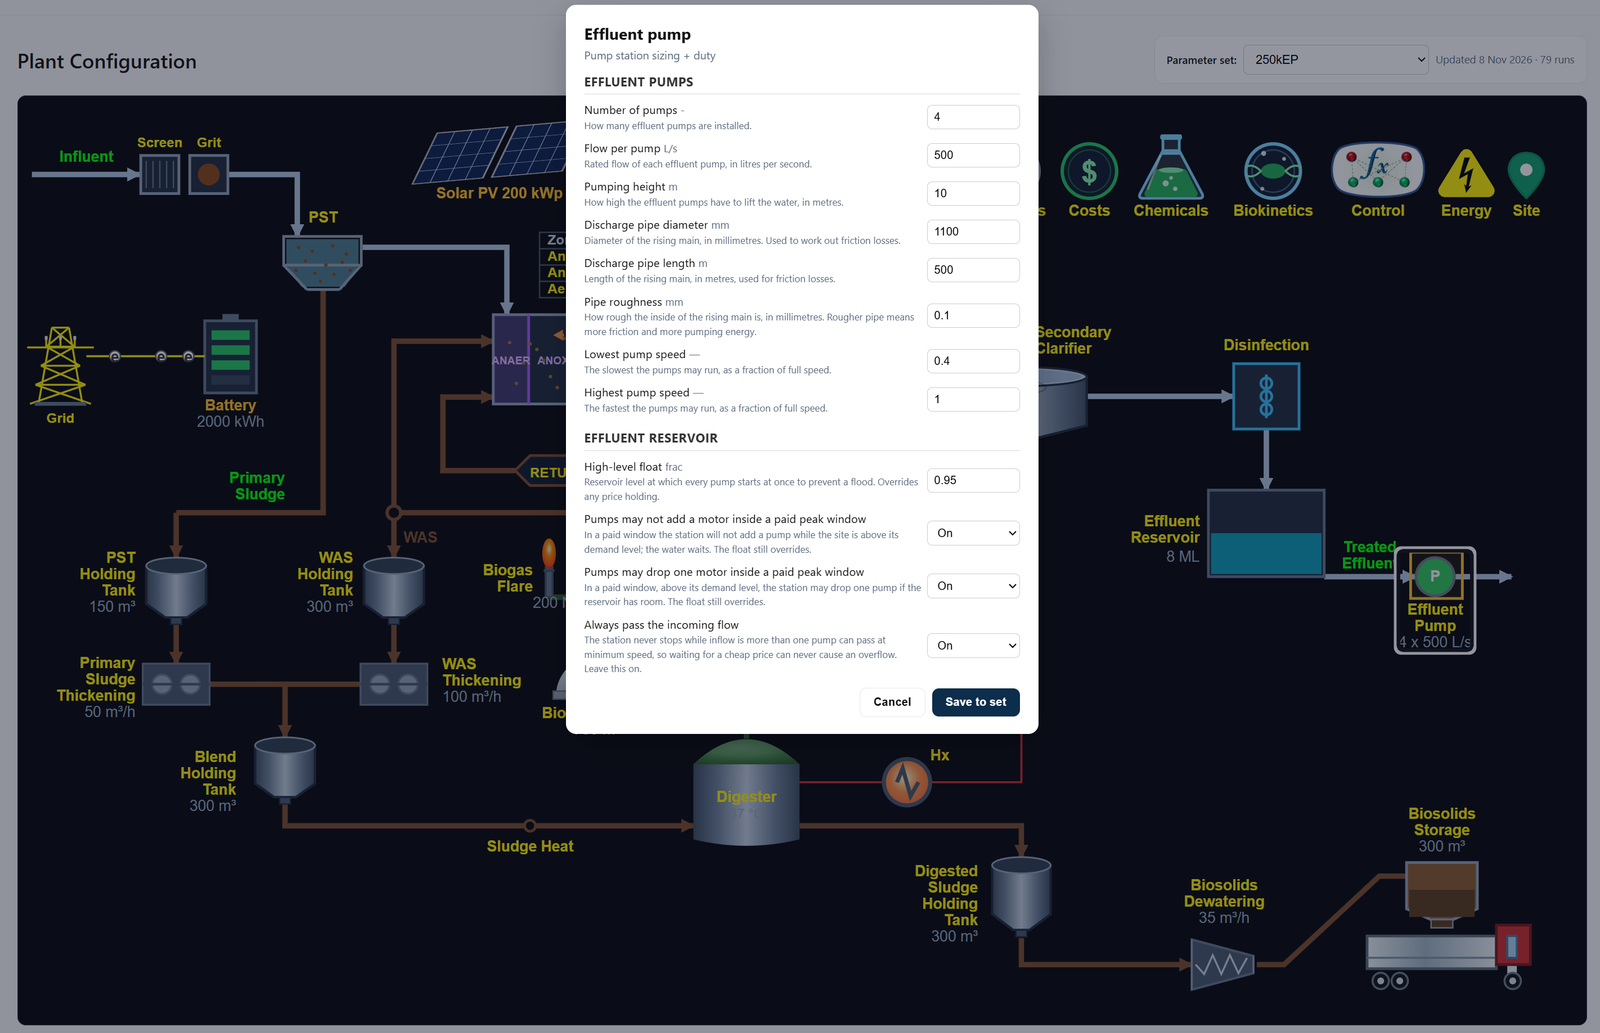
Configure the simulator
Capital and operating cost
What is counted
Capital cost, a fixed cost and annual maintenance for each asset. Incremental cost against incremental saving, then payback, net present value and the return achieved.
What is required
Twelve months of bills, inflow and load data, and equipment schedules. Missing data is identified before the work starts.